ERCOFTAC PC Germany South
Turbulent Boundary Layer from Low to Moderate Re
Authors: Jason Appelbaum, Tobias Gibis, Christoph Wenzel
(Institute of Aerodynamics and Gas Dynamics, University of Stuttgart, Germany)
Sergio Pirozzoli
(Department of Mechanical and Aerospace Engineering, Sapienza University of Rome, Italy)
The animation illustrates the evolving flow field of a compressible turbulent boundary layer in the convective reference frame of the freestream velocity. Three quantities are shown, namely the magnitude of density gradient, the mean-removed total temperature and the mean-removed streamwise velocity. In its early stages of development, the characteristic ‘turnover’ period of large-scale eddies is relatively short, thus structures are quickly recycled to and from the near-wall region. As the layer develops and the boundary-layer thickness 𝛿 grows, the range of coherent eddy scales increases. Most notably, large inertial eddies form in the growing boundary layer which have identifiably consistent shapes for several 𝛿 worth of convected distance. The emergence of such structures is associated with the arrival upon an ultimate turbulent state in which the velocity profile in the outer region of the boundary layer (comprising >85% of 𝛿) becomes self-similar when normalized by a set of local ‘outer’ scales.
Scientific Abstract
The visualization is derived from a direct numerical simulation (DNS) of a spatially developing flat-plate turbulent boundary layer (TBL) in the low supersonic regime with zero pressure gradient. The goal of the study is to examine in detail the changes to the flow field as the outer layer develops into a self-similar state and, in particular, how this is related to the industrially relevant high Reynolds number (Re) regime of wall turbulence as covered in depth by Marusic et al. (2010) and Smits et al. (2011), among others. Already at this early stage of research, during which the visualization has been produced, scientifically compelling conclusions have been derived which are unique within the study of TBLs. Most notably, the DNS results represent a ‘missing link’ between numerical and experimental datasets, bridging a critical Re regime in which the outer layer of the TBL develops to a state where the mean velocity profile can be effectively normalized into a Re-independent form by ‘outer’ scales such as the 99% hydrodynamic boundary-layer thickness 𝛿99 or the Rotta-Clauser length scale Δ, the latter of which is used in Fig. 1(𝑎). Here, it is clear that all profiles Re𝜃𝑖 ⪆ 4000 collapse to a common form. As has been shown in a submitted publication (Appelbaum et al. 2025), the Re at which outer-layer saturation occurs coincides with a noticeable and abrupt change in the trend of the friction coefficient 𝑐 𝑓 vs Re, as is made readily visible in Fig. 1(𝑏). This property had not been well captured in a single experiment (numerical or physical), as DNS datasets were either limited in Re such that they did not capture the ‘crossover’ between the disparate 𝑐 𝑓 (Re) trends for low and high Re, or established inflow-independent, trustworthy TBL development at Re in excess of the crossing. Experimental measurements which directly measure the wall shear stress 𝜏𝑤, for example Österlund et al. (2000); Nagib et al. (2006), have largely focused on the high-Re regime where the wake profile has already become self-similar, as is visible in Fig. 1(𝑏). In the low-Re regime, 𝑐 𝑓 (Re) has often been approximated by a power law of the form 𝑐 𝑓 ≈ 𝑎·Re𝑏 𝜃 , for example in Smits et al. (1983), where 𝑎 and 𝑏 are constants. Analytically derived formulations become more applicable at sufficiently high Re, such as the ‘Coles-Fernholz 2’ correlation 𝑐 𝑓 ≈ 2[𝜅−1 ln(Re𝜃 ) + 𝐶]−2, discussed in Nagib et al. (2007), where 𝜅 and 𝐶 are constants. The present DNS represents a first numerical glimpse into the dynamics of a TBL in the region where these long-accepted trends intersect, illuminating the scaling behavior in the ‘moderate’ Re regime (designated by the establishment of outer-layer self-similarity). The conclusions of the study are substantiated by exceptional agreement with present DNS as well as overlap with reliable experimental datasets when extrapolated. The visualization aesthetically illustrates the process by which the development of large-scale coherent turbulent structures contributes to the formation of a fully-developed, self-similar outer layer. Most poignantly, one sees that at low Re (at the beginning of the video), even the largest structures are still small enough in scale to be quickly dissipated by viscous mechanisms near the wall. Near the middle of the domain, one sees the ejection of large structures which largely decouple from the near-wall region. These ‘superstructures’ or ‘large-scale motions’ are transported relatively unperturbed for many 𝛿 in the streamwise direction before breaking down, and likely constitute a necessary ingredient for achieving the final, full form of the defect velocity profile shown in Fig. 1(𝑎). The DNS was a high-performance computing milestone for the research group, demonstrating the efficient computation of a production case (as opposed to a short scaling test) at full-machine scale using the code NS3D. The full grid totaled more than 25 billion points. Computation was performed at the High Performance Computing Center Stuttgart (HLRS) and made possible by funding from the German Research Foundation (DFG) and the Gauss Centre for Supercomputing (GCS).
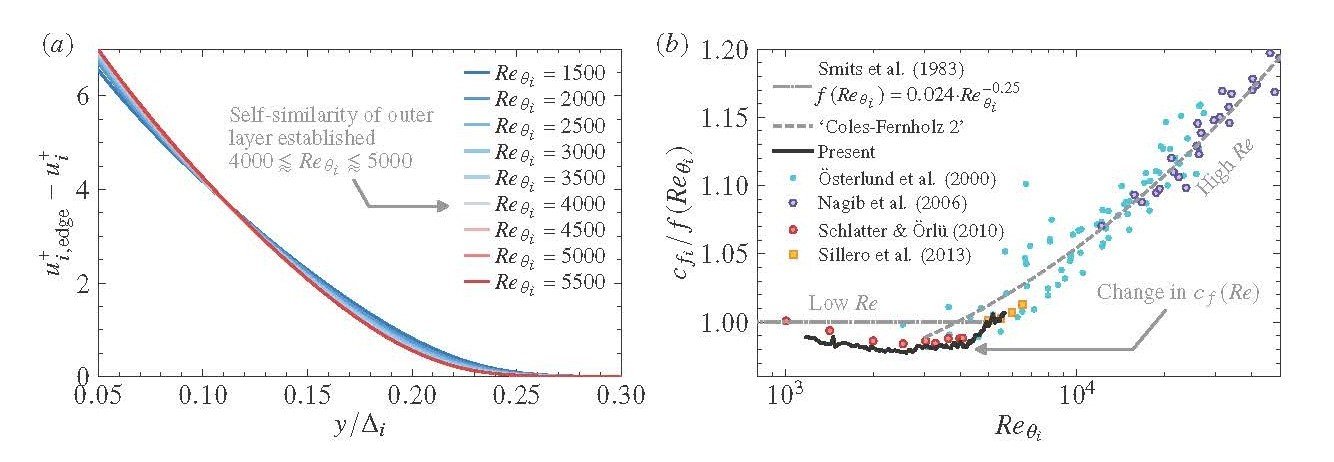
Figure 1: (𝑎) Wall-normal profile of mean streamwise defect velocity and (𝑏) compensated friction coefficient 𝑐 𝑓 vs momentum-thickness Reynolds number 𝑅𝑒𝜃 . Subscript ‘𝑖’ indicates transformation of compressible data into an equivalent incompressible form. Superscript ‘+’ indicates normalization with viscous characteristic scales.
Recent Publications
Related to Research Scientific findings related to the direct numerical simulation have been recently submitted for publication in the Journal of Fluid Mechanics and are currently under review.
References
Appelbaum, Jason, Gibis, Tobias, Pirozzoli, Sergio & Wenzel, Christoph 2025 The onset of outer-layer self-similarity in turbulent boundary layers. Journal of Fluid Mechanics, Manuscript under review.
Marusic, Ivan, McKeon, Beverley J, Monkewitz, Peter A, Nagib, Hassan M, Smits, Alexander J & Sreenivasan, Katepalli R 2010 Wall-bounded turbulent flows at high reynolds numbers: recent advances and key issues. Physics of Fluids 22 (6), 065103.
Nagib, Hassan M, Chauhan, Kapil A & Monkewitz, Peter A 2007 Approach to an asymptotic state for zero pressure gradient turbulent boundary layers. Philosophical Transactions of the Royal Society A: Mathematical, Physical and Engineering Sciences 365 (1852), 755–770.
Nagib, H. M., Christophorou, C. & Monkewitz, P. A. 2006 High Reynolds Number Turbulent Boundary Layers Subjected to Various Pressure-Gradient Conditions. In IUTAM Symposium on One Hundred Years of Boundary Layer Research (ed. G. E. A. Meier, K. R. Sreenivasan & H.-J. Heinemann), pp. 383–394. Dordrecht: Springer Netherlands.
Schlatter, Philipp & Örlü, Ramis 2010 Assessment of direct numerical simulation data of turbulent boundary layers. Journal of Fluid Mechanics 659, 116–126.
Sillero, Juan A., Jiménez, Javier & Moser, Robert D. 2013 One-point statistics for turbulent wall-bounded flows at Reynolds numbers up to 𝛿+ ≈ 2000. Physics of Fluids 25 (10), 105102.
Smits, A. J., Matheson, N. & Joubert, P. N. 1983 Low-Reynolds-Number Turbulent Boundary Layers in Zero and Favorable Pressure Gradients. Journal of Ship Research 27 (03), 147–157.
Smits, A. J., McKeon, B. J. & Marusic, I. 2011 High–Reynolds Number Wall Turbulence. Annual Review of Fluid Mechanics 43, 353–375.
Österlund, Jens M 1999 Experimental studies of zero pressure-gradient turbulent boundary layer flow. PhD thesis, Royal Institute of Technology, Department of Mechanics.
Österlund, Jens M., Johansson, Arne V., Nagib, Hassan M. & Hites, Michael H. 2000 A note on the overlap region in turbulent boundary layers. Physics of Fluids 12 (1), 1–4.